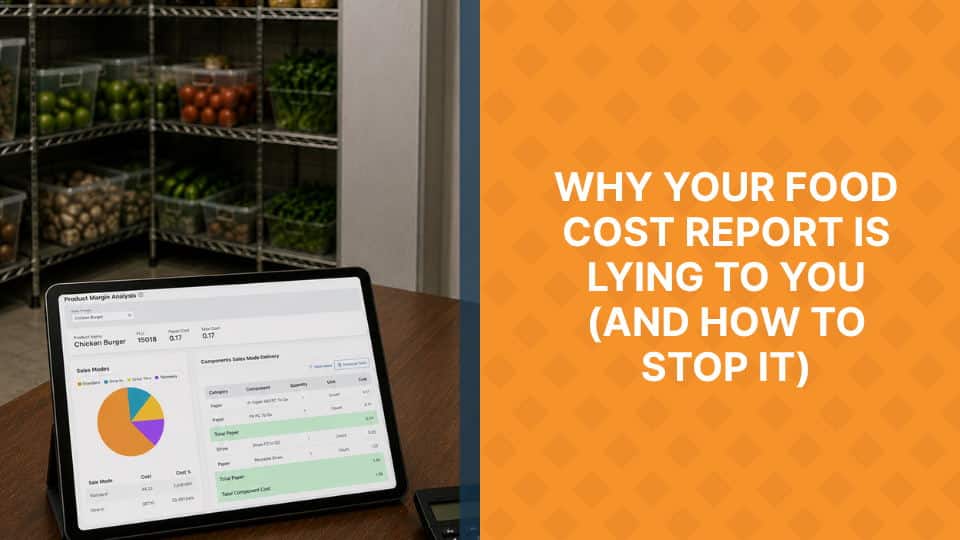
There’s the food cost you think you’re running. And then there’s the food cost you’re actually running.
For most multi-unit operators, those two numbers don’t match, and the difference rarely shows up the way you’d expect. It’s not a bad quarter or a supplier blowout. It’s quieter than that. It accumulates shift by shift, location by location, until someone in finance is staring at a weekly report trying to explain a number that doesn’t add up.
That gap has a name: inventory variance. And it’s probably the least dramatic, most expensive problem in your operation right now.
What Inventory Variance Actually Looks Like
Theoretical food cost calculates what a brand should have spent based on what it sold and its recipe specifications. Actual food cost reflects what was truly consumed. The gap between those two figures is inventory variance, and it has three primary sources.
Receiving errors occur when deliveries arrive short-weighted, substituted, or priced differently than the purchase order. A location receiving 18 lbs of protein instead of 20 lbs records a phantom inventory surplus that distorts usage calculations for weeks. Across 30 locations, the cumulative distortion becomes significant. This is a problem closely linked to supplier price drift, and it compounds whenever purchasing data and inventory data live in separate systems.
Portioning drift happens on the line. A recipe specifies 6 oz of protein; a cook plates 7.5 oz during a busy dinner service. No single shift looks alarming, but across a portfolio of locations over a full period, that 25% portioning excess has a measurable EBITDA impact. Without real-time usage monitoring, the problem surfaces only at month-end reconciliation, long after the margin has already been consumed.
Waste and spoilage tracking gaps represent the third leak. Unrecorded waste, inconsistently logged employee meals, and undocumented prep errors all create discrepancies between theoretical and actual usage. When these are tracked manually, completeness varies by location. When they are not tracked at all, variance reports become directionally misleading.
Why Disconnected Systems Amplify the Problem
When inventory management, purchasing, and POS data operate in separate platforms, reconciling theoretical against actual usage requires manual extraction, reformatting, and correlation. By the time a team identifies the variance root cause, the next period has already started generating new discrepancies.
The inventory management platform built into SynergySuite connects directly to live purchasing data and sales records, so theoretical usage calculates automatically from actual transactions rather than from manually maintained recipe spreadsheets. When a location’s actual consumption diverges from theoretical, the variance is visible in real time, not at the end of the accounting period.
Real-Time Visibility Changes the Response Window
The practical value of real-time inventory tracking is not just faster reporting. It is a fundamentally shorter response window. A portioning issue caught within 72 hours gets corrected before it compounds into a three-week trend. A receiving discrepancy flagged immediately gets resolved before it distorts the following week’s purchase order.
When purchasing software feeds invoice data directly into inventory calculations, receiving variances surface automatically on delivery rather than when someone manually cross-references a purchase order against a count sheet. That is the difference between proactive margin management and reactive reporting.
Portfolio-Wide Visibility Identifies Which Locations Need Attention
For brands managing 20 or more locations, the real power is cross-location comparison. Not every location executes with the same consistency. Some run tight variance. Others drift persistently above theoretical. Without restaurant reporting and analytics that aggregates inventory performance across the full portfolio, it is nearly impossible to distinguish locations with structural portioning problems from those experiencing legitimate volume fluctuations.
Knowing that three locations account for 60% of portfolio-wide food cost variance is actionable. Knowing only that overall food cost ran 2.4 points above target is not. Unified data makes the former possible without requiring analysts to manually correlate reports across five different systems.
The same logic applies to menu testing governance: protecting margins during new item launches requires the same real-time inventory visibility that protects margins during standard operations. The platform and the discipline are inseparable.
The Margin Is There. The Data Just Needs to Reach It.
Inventory variance is recoverable. The losses it represents are not the result of bad strategy or weak demand. They are execution gaps that real-time data can prevent. For multi-unit brands operating at scale, the question is not whether inventory variance exists. It is whether the platform in place surfaces it quickly enough to act on it.
See how SynergySuite closes the gap between theoretical and actual food cost across your entire portfolio.